Computing driver-gene score using integrated genomics and transcriptomics profiles of tumor and matched-normal tissues
Content
- Introduction
- Flowchart
- Example usage
- Estimating gene- and isoform expression (Sequgio)
- Preprocessing BAM files (GATK)
- Statistical significance of association between allelic counts and tumor/normal status for somatic variant calling (SOMAC)
- Predicting impact of somatic mutations on protein coding genes (snpEff)
- Integrating gene- and isoform expressions and predicted somatic mutations to derive driver genes z-scores (Network Enrichment Analysis)
- References
1. Introduction
All cancers arise as a result of somatically acquired changes in the DNA of cancer cells, yet not all somatic abnormalities found in a cancer genome are involved in tumor development (carcinogenesis). Passenger mutations occur by genetic hitchhiking in an unstable environment and they have no effect on the fitness of a clone or the tumor progression. Distinguishing driver mutations actively involved in carcinogenesis from passenger mutations is a key step to understand the mechanism of tumor emergence and evolution, and to determine potential therapeutic targets.
With the progress of the sequencing methods full profiles of tumor genomes and exomes can now be obtained which further enables unbiased search for drivers mutations. Methods based on functional and/or frequency approaches are being proposed, e.g. DOTS-Finder, MuSiC, OncodriveFM.
DNA and RNA sequencing of tumor and matched-normal tissues from the same patient allows accurate detection of somatic mutations and differential expression at isoform-level. To integrate mutation, expression and functional data from the different omics data, we are developing a pipeline to calculate driver-gene score (DGscore). To contribute to the score, a gene has to satisfy four key properties:
- frequently mutated
- with mutational impact on protein coding gene,
- exhibit a large tumour-normal differential expression and
- functionally linked to many differentially-expressed neighbours in a functional gene network, such as protein-protein interaction network.
2. Flowchart
We have developed a computational approach to calculate driver-gene scores using existing bioinformatics tools as well as tools previously developed by our group and a set of in-house written bash, python and R scripts. For learning purposes the approach can be viewed in five steps as shown in the gray boxes on Figure 1. Briefly, these include 1): estimating gene- and isoform expression using joint statistical model accounting for non-uniform isoform-specific read distribution as implemented in our Sequgio pipeline; 2) preprocessing BAM files; 3) assessing statistical significance of association between alleic counts and tumor/normal status for somatic variant calling; 4) predicting impact of somatic mutations on protein coding genes; 5) integrating gene- and isoform expressions and predicted somatic mutations to derive driver genes z-scores using Network Enrichment Analysis.
Below, we explain each step in more details, providing examples of usage and links to more detailed description. We also provide ready-to-download scripts, where applicable, to speed-up learning and setting-up process. It is recommended to run all calculation using high performance computing cluster e.g. UPPMAX for users in Sweden. Although our approach is not system dependent, the majority of the scripts has been developed and tested using UPPMAX and we will therefore assume access to UNIX environment in the below description. To run our pipeline effectively, various bioinformatics approaches and tools have to be understood. Unless one is already familiar with GATK and snpEff and our previously developed methods, Sequgio and Network Enrichment Analysis, setting-up the full run may take several days. As the approach is build upon many tools that we feel are best to be put together by the user, we focus on providing the essential know-how on using our approach, and assume basic bioinformatics knowledge.
The complete run for one patient, with 6GB tumor and matched-normal .BAM files (each) from WXS sequencing (WXS-seq) and 5GB tumor and matched-normal .BAM files (each) from RNA sequencing (RNA-seq) can be completed in 24h on UPPMAX using 4 cores.
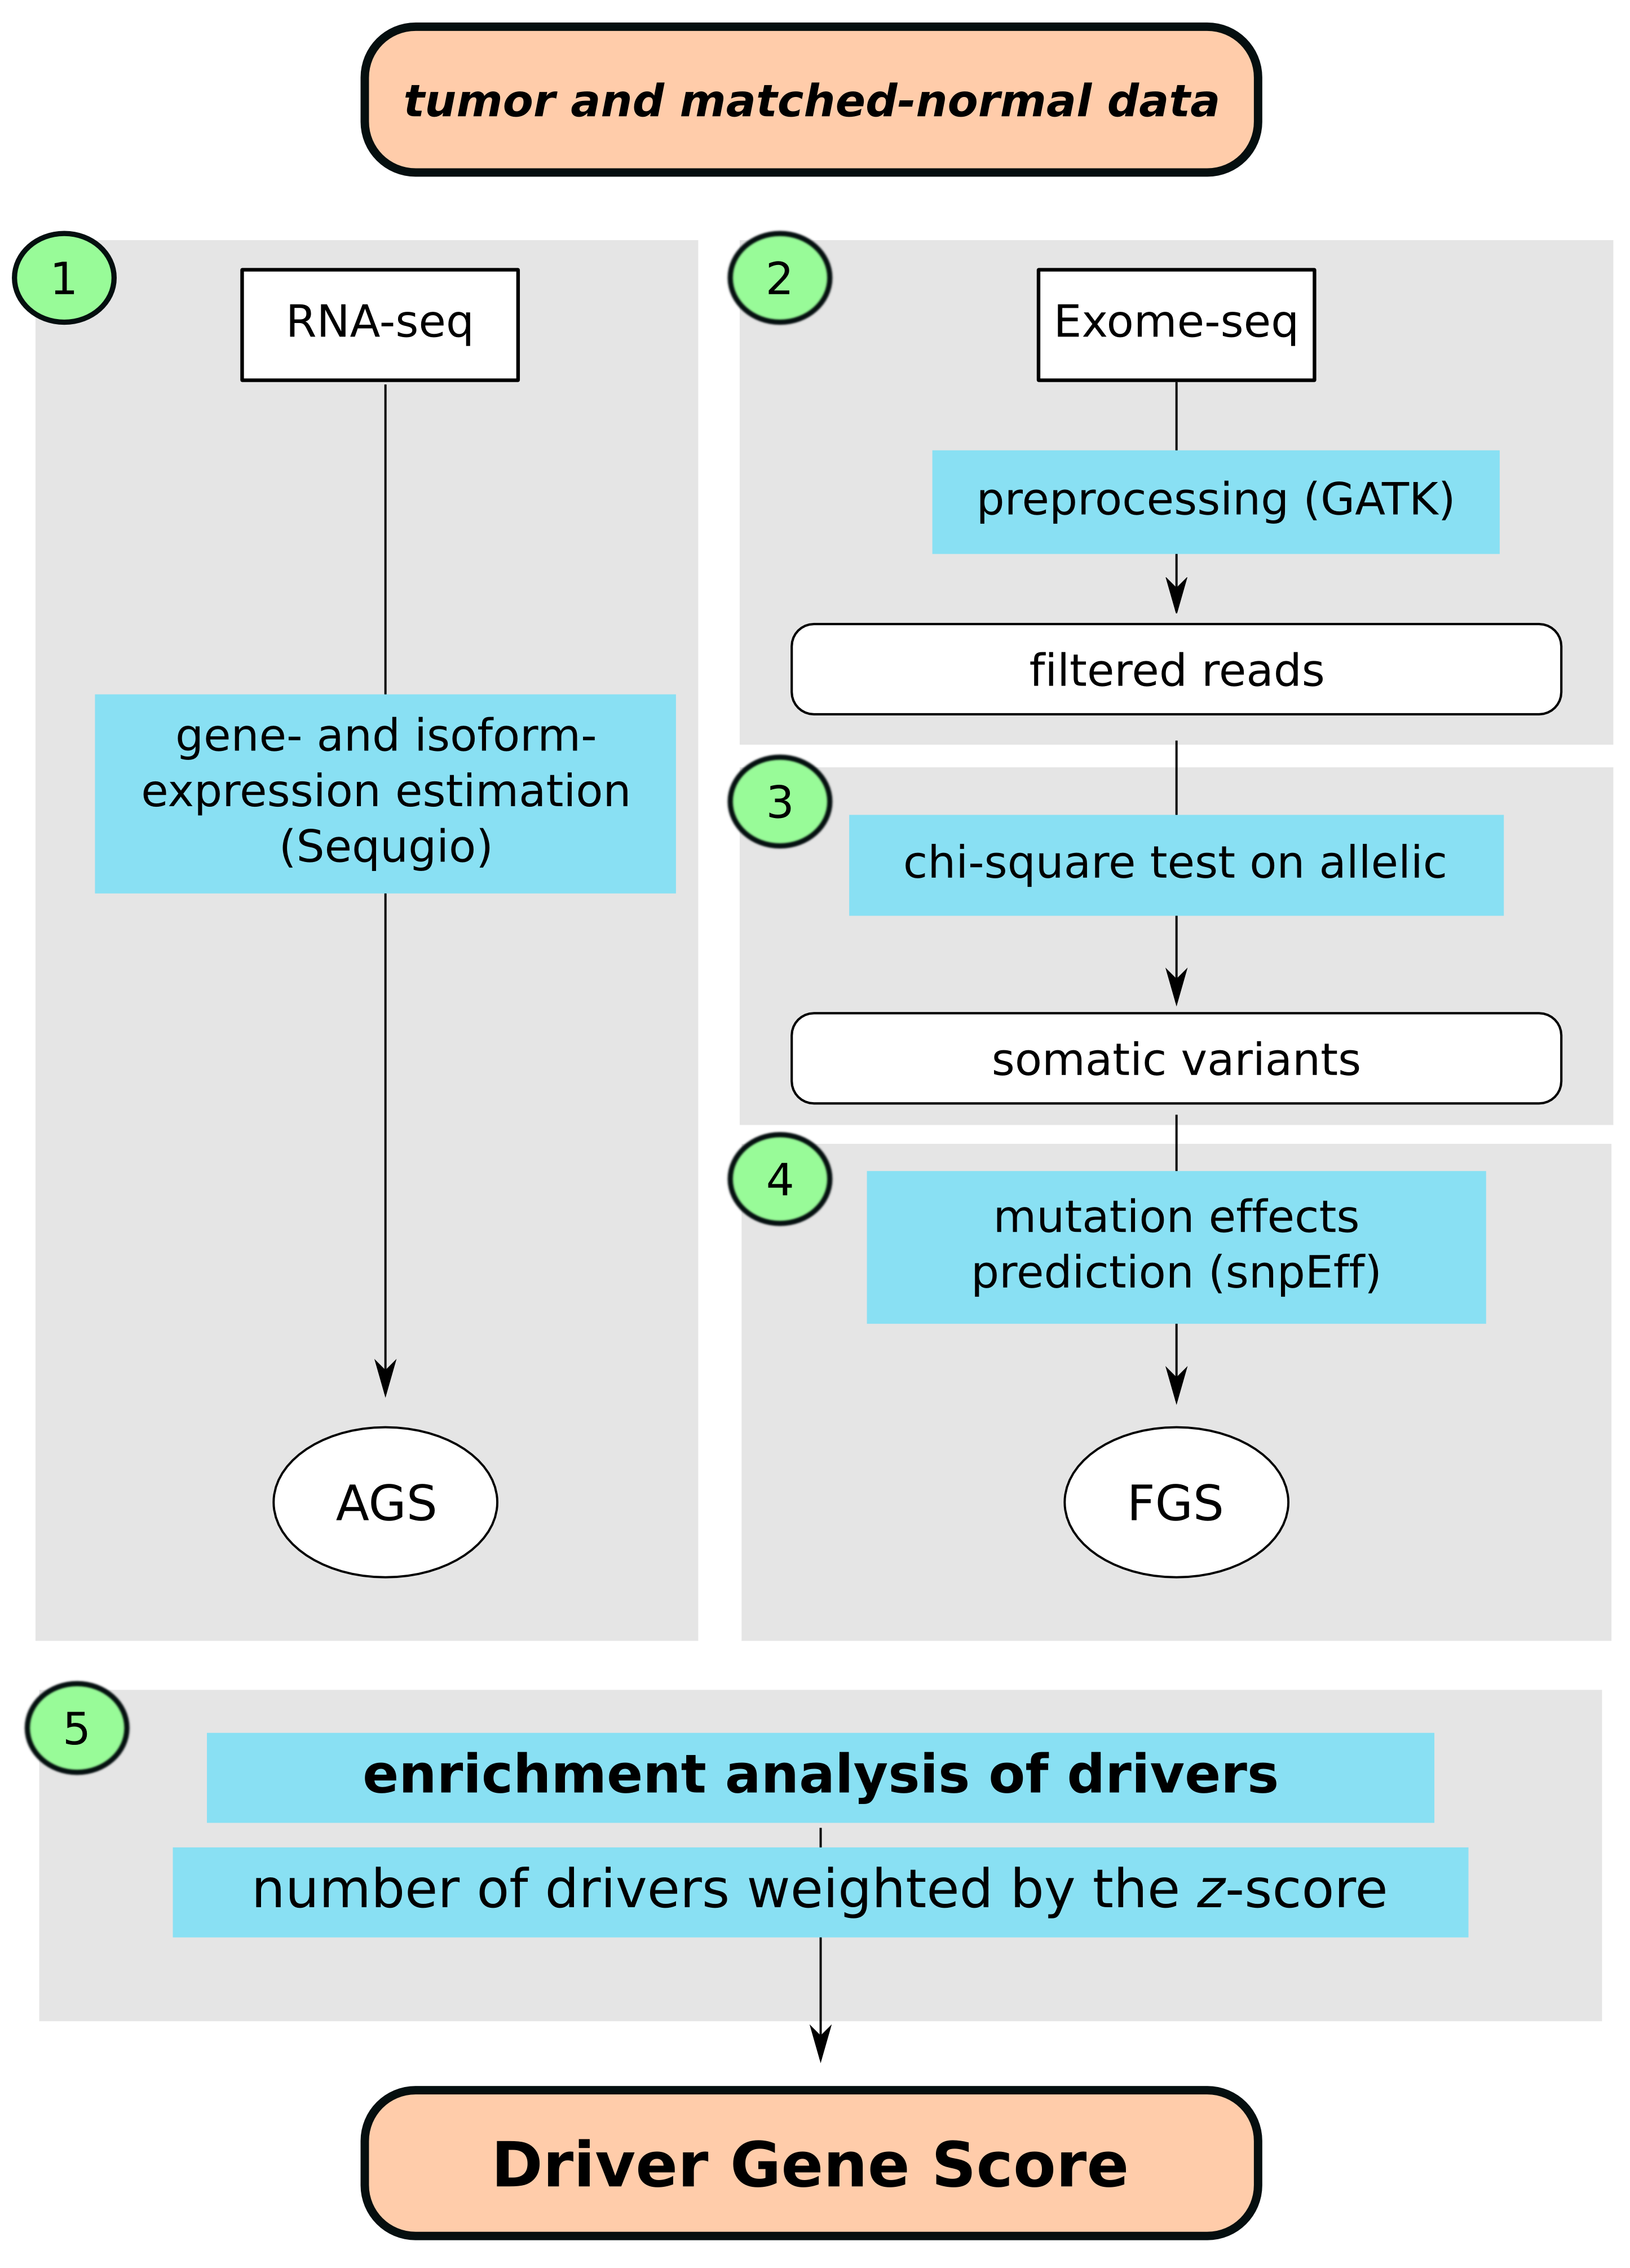
Figure 1. Flowchart of computational identification of the driver genes based on the tumor and matched-normal RNA-seq and Exome-seq tissue data; AGS, altered gene sets; FGS, functional gene set. Step 1: estimating gene- and isoform expression using joint statistical model accounting for non-uniform isoform-specific read distribution as implemented in our Sequgio pipeline; Step 2: preprocessing BAM files; Step 3: assessing statistical significance of association between allelic counts and tumor/normal status for somatic variant calling; Step 4: predicting impact of somatic mutations on protein coding genes; Step 5: integrating gene- and isoform expressions and predicted somatic mutations to derive driver genes z-scores using Network Enrichment Analysis.
3. Example usage
To use the Driver Genes approach, you need 4 BAM files per patient, including tumor and matched-normal WXS-seq data and tumor and matched-normal RNA-seq. These files should be at least sorted and indexed, but we also recommend marking duplicates and removing reads with 0 quality score. Example script showing preparation of the BAM files is under our SOMAC wiki post (More on BAM processing).
Step 1: Estimating gene- and isoform expression (Sequgio)
Sequgio uses a joint statistical model that accounts for non-uniform isoform-specific read distribution when estimating gene isoform expression. Sequgio is implemented as R package, available from the GitHub and soon to be available as part of the Bioconductor. Example usage and data have been released with the Sequgio publication [1] and are described in details in another post of our Wiki. Briefly, using RNA-seq data (both tumor and normal for each patient) we 1) create annotation template, 2) create design matrix, 3) import BAM files and create a count matrix and 4) fit the model to obtain gene-isoform expression estimates.
Here you can download R script containing the example usage and data as released with Sequgio publication. The script contains explanatory comments.
Download sequgio.R script: sequgio.R
Step 2: Preprocessing BAM files (GATK)
Variant calling is not error rate free, with major sources of errors including erroneous realignment in low-complexity regions and incomplete reference genome with respect sample. It could be therefore good practice to include post-alignment BAM processing steps, including realignment and base quality recalibration, especially when using variant callers not performing local realignment.
We used GATK for post-alignment and base quality recalibration and we refer you to well-documented GATK website for details. However, the example bash script can be found below.
This step can be also performed using our SOMAC v01 pipeline, as described in Step 3: Statistical significance of association between allelic counts and tumor/normal status for somatic variant calling (SOMAC).
#!/bin/bash

# GATK realignment and base quality recalibration example.sh script
 # To be run from the directory where example.bam and example.bam.bai is located

# Specify pathway to GATK, ref.fasta and indels.vcf
> path2GATK="/sw/apps/bioinfo"
> refFasta="/proj/b2014296/DATA/FILES/Homo_sapiens_assembly19.fasta"
> refKnown="/proj/b2014296/DATA/FILES/Mills_and_1000G_gold_standard.indels.b37.vcf"

# GATK (3.3.0) RealingerTargetCreator
> java -Xmx2g -jar $path2GATK/GATK/3.3.0/GenomeAnalysisTK.jar -T RealignerTargetCreato -R $refFasta -I example.bam -o forIndelRealinger.intervals -known $refKnown

# GATK (3.3.0) IndelRealinger
> java -Xmx2g -jar $path2GATK/GATK/3.3.0/GenomeAnalysisTK.jar -T IndelRealigner -R $refFasta -I example.bam -targetIntervals forIndelRealigner.itervals -o realigned.bam

# GATK (3.3.0) Base Recalibrator
> java -Xmx2g -jar $path2GATK/GATK/3.3.0/GenomeAnalysisTK.jar -T BaseRecalibrator -I realigned.bam -R -knownSites $refKnown -o recal.grp

# GATK (3.3.0) PrintReads
> java -Xmx2g -jar $path2GATK/GATK/3.3.0/GenomeAnalysisTK.jar -T PrintReads -BQSR recal.grp -o recalibrated.bam -I reca.grp
Download example post alignment BAM processing .sh script here: GATK_example.sh
Step 3: Statistical significance of association between allelic counts and tumor/normal status for somatic variant calling (SOMAC)
The next step after processing of the whole exosome sequencing data is to call somatic variants using the paired tumor and normal samples. To this end we have developed SOMAC pipeline that is based on standard parametric statistical tests (chi-square) and novel multidimensional false discovery rate (FDR) estimation (Ploner et al. 2006) The pipeline is described in details here. As part of this pipeline it is possible to automatically run bam post-alignment processing (realignment and base quality recalibration as described in step 2).
# Running SOMAC
> bash path/to/somac config.TN inputFiles.txt partition.txt
SOMAC output is a table of potential somatic variants including chi-square, fdr2d and LRT statistics (in .txt and .RData) and .vcf file containing the potential somatic variants. These can be further filtered using desired statical criteria, e.g. chi-square < 0.001.

Download SOMAC scripts: Somac_v01
Step 4: Predicting impact of somatic mutations on protein coding genes (snpEff)
To identify the driver genes, we focus on significant high and moderate impact mutations, that is mutations leading for instance to exon deletions, frame shifts or codon insertion and deletions. To identify these we used snpEff, a variant annotation and effect prediction tool (Cingolani et al. 2012). For example, significant isoforms (top 1000 ranked using chi-square and chi-square < 0.001) mutated in at least ten patients and predicted to have high or moderate impact in more than two patients were kept on the list of potential driver genes when searching for driver genes predictive of breast cancer survival based on the 60 paired tumor and normal TCGA samples.
# Running snpEff
> java -Xmx4g -jar /path/to/snpEff.jar GRCh37.75 input.vcf > output.vcf
Download snpEff here & more on snpEff can be found here
Step 5: Integrating gene- and isoform expressions and predicted somatic mutations to derive driver genes z-scores (Network Enrichment Analysis)
Network Enrichment Analysis (NEA) extends the overlap statistics in Gene-set enrichment analysis to network links between genes in the experimental set and those in the functional categories (Alexeyenko et al. 2012). We use it to uncover potential driver genes that have strong network connectivity with a list of altered gene set (AGS). Each mutated gene is refereed to as functional gene set (FGS) and the AGS are derived from the differentially expressed genes and isoforms (Sequgio). A quantitative enrichment z-score is calculated to assess statistical significance of over-represented direct links between AGS and FGS; the z-score allows to prioritise mutated genes (Alexeyenko et al. 2012).
To identify common-driver genes we set AGS as genes with differentially expressed isoform levels between tumor and normal.
To identify patient-specific driver genes we set AGS as genes with large tumor/normal expression ratio within each patient.
# Running NEA in R
> require(nea)
> res.MNEA <- nea(ags=AGS, fgs=FGS, fgslib=NULL, network=mnet, pnet=NET, nperm=50)

where:
ags: a vector of altered genes or isoforms, e.g. obtained from Sequgio
fgs: a list of functional gene sets, e.g. obtained from mutation effect prediction
fgslib: a character of the name of annotation data
network: a vector of gene pairs representing the network link
pnet: a list of randomly permuted networks
nperm: number of permutations

# For more detailed usage
> ?nea
Download NEA here and follow fully worked-out example in Section C of Additional file 1 (Alexeyenko et al. 2012)
Questions?
References
Alexeyenko, Andrey, Woojoo Lee, Maria Pernemalm, Justin Guegan, Philippe Dessen, Vladimir Lazar, and Janne Lehti. 2012. “Network Enrichment Analysis : Extension of Gene-Set Enrichment Analysis to Gene Networks.” BMC Bioinformatics 13: 226.
Cingolani, Pablo, Adrian Platts, Le Lily Wang, Melissa Coon, Tung Nguyen, Luan Wang, Susan J Land, Xiangyi Lu, and Douglas M Ruden. 2012. “A Program for Annotating and Predicting the Effects of Single Nucleotide Polymorphisms, SnpEff: SNPs in the Genome of Drosophila Melanogaster Strain w1118; Iso-2; Iso-3,” no. June: 80–92.
Ploner, Alexander, Stefano Calza, Arief Gusnanto, and Yudi Pawitan. 2006. “Multidimensional Local False Discovery Rate for Microarray Studies.” Bioinformatics (Oxford, England) 22 (5): 556–65.
Suo, Chen, Stefano Calza, Agus Salim, and Yudi Pawitan. 2013. “Joint Estimation of Isoform Expression and Isoform-Specific Read Distribution Using Multi-Sample RNA-Seq Data,” 1–8.
![]()